OpsCore Dashboard
A real-time operational dashboard providing centralized visibility into containerized AI services running on a VPS. Python metrics agent on the server. Next.js frontend deployed to Vercel for remote monitoring from anywhere.
"If you're running AI agents in production, you need to see what they're doing. Not just whether they responded, but whether the infrastructure underneath them is healthy."
01 The Problem
I was running multiple containerized services on a VPS: OpenClaw (multi-agent orchestration), Hermes (communications agent), and the portfolio site itself. All behind a Traefik reverse proxy. Each service had its own health characteristics, resource consumption patterns, and failure modes.
Without centralized monitoring, diagnosing issues meant SSH-ing into the box and running ad-hoc Docker commands. No single view of system health. No historical metrics. No way to check status from a phone without terminal access.
02 What I Built
A two-tier monitoring system: a lightweight Python agent running on the VPS that exposes system and container metrics via an API-key-secured endpoint, and a Next.js dashboard hosted on Vercel that pulls and visualizes those metrics in real time.
VPS Agent
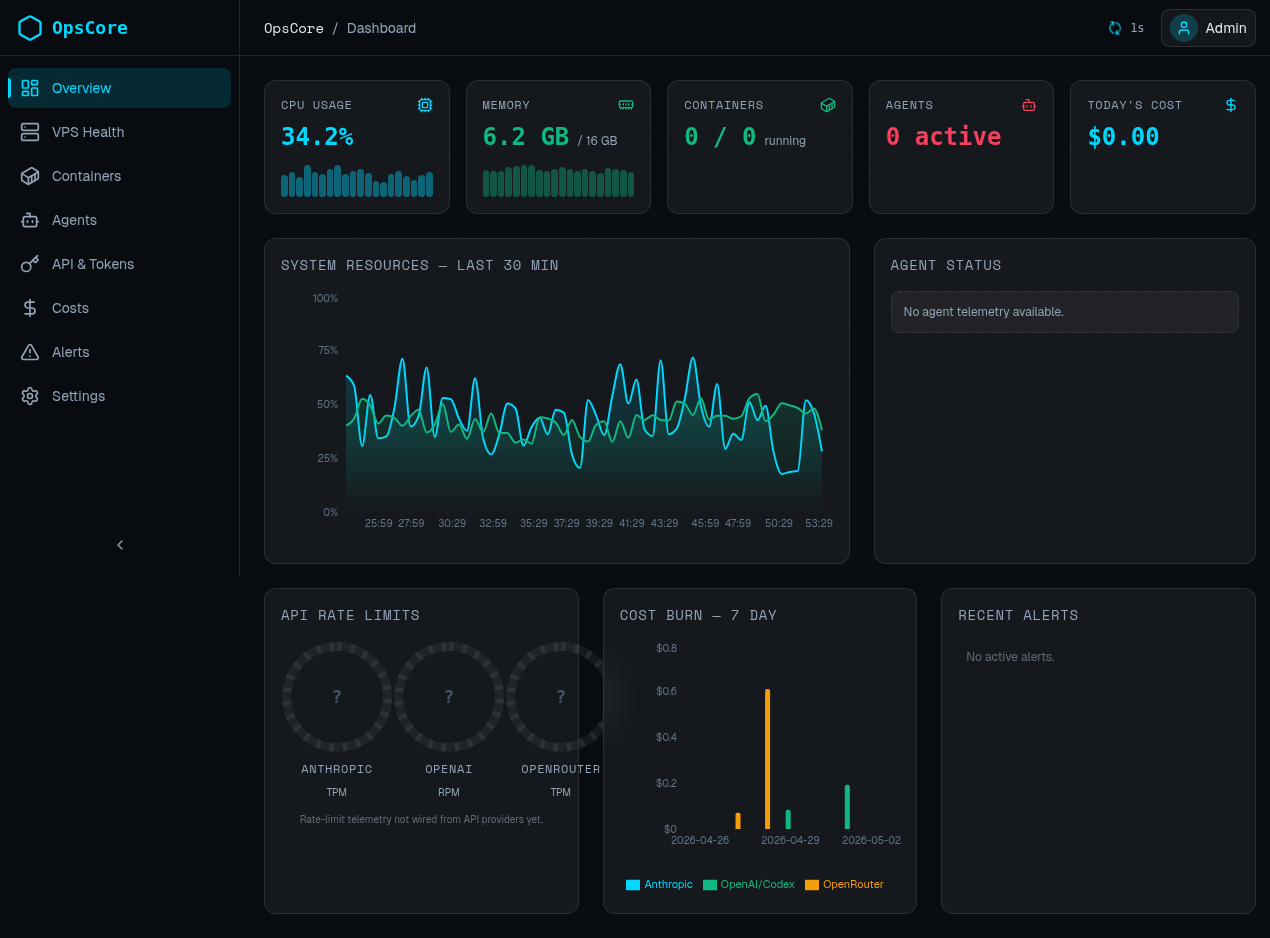
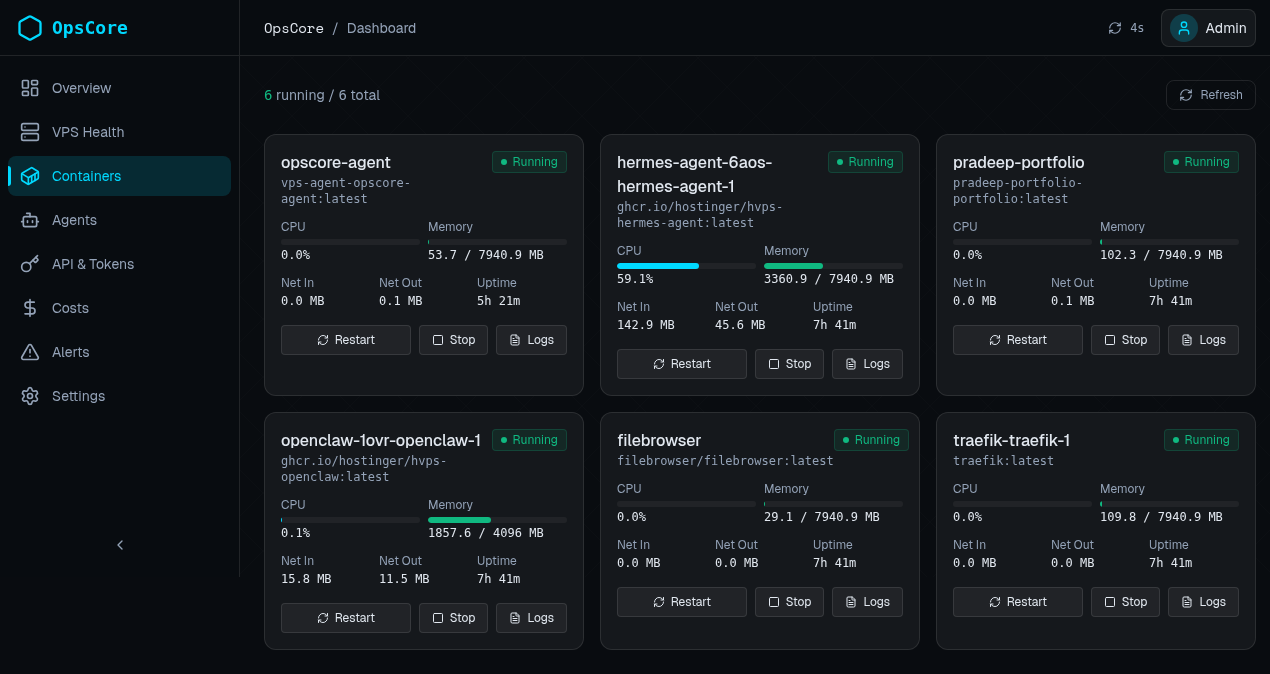
Python service on port 8765 exposing CPU, memory, disk stats and container health checks
Next.js Dashboard
TypeScript frontend with charts, status cards, and real-time data polling from the VPS agent
Traefik Integration
Reverse proxy routing for multi-service architecture on a single VPS
Service Monitoring
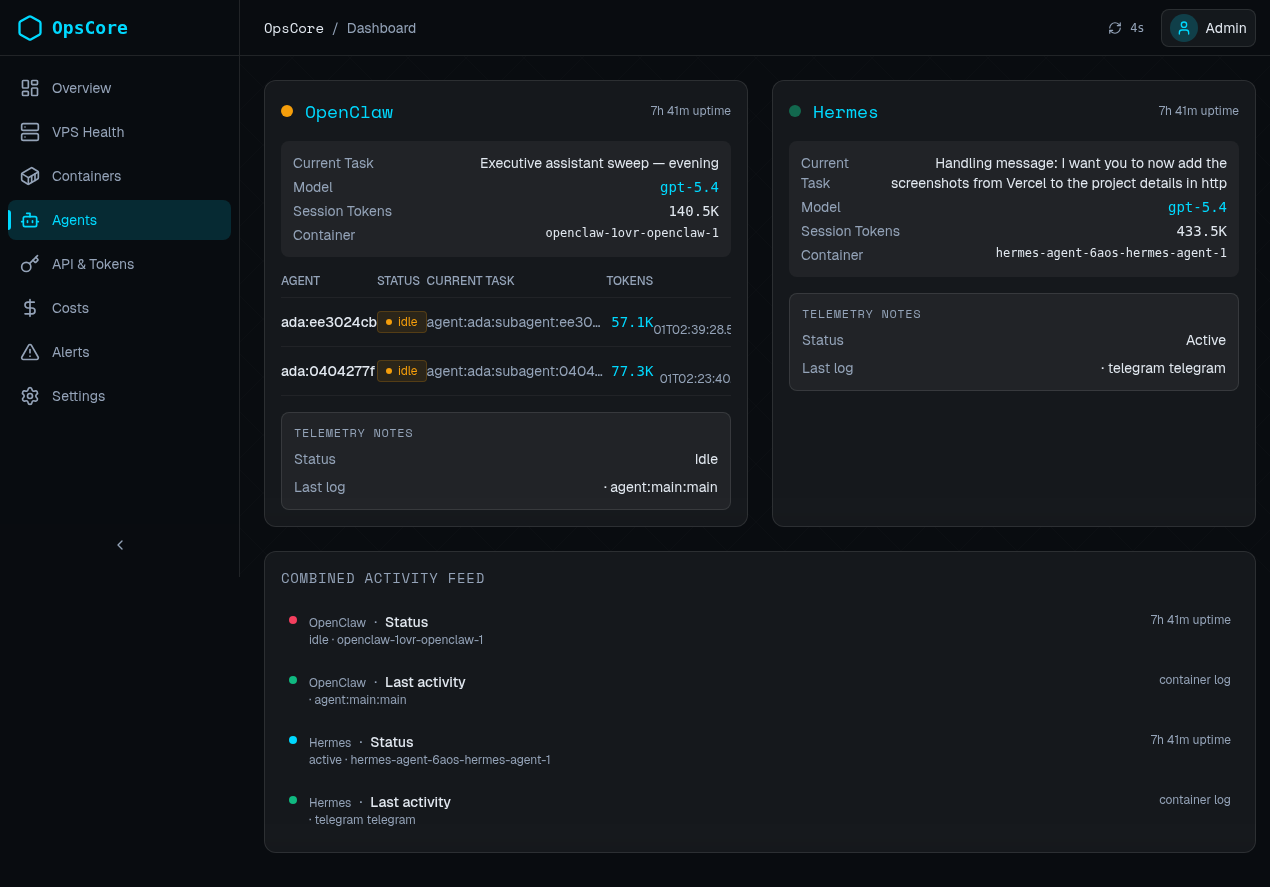
Reads state from OpenClaw, Hermes, and Portfolio containers for unified health visibility
The agent reads state directories from each managed service and aggregates system-level metrics (CPU, memory, disk) alongside per-container health. The dashboard provides card-based status views and charts for trend analysis, all secured by API-key authentication.
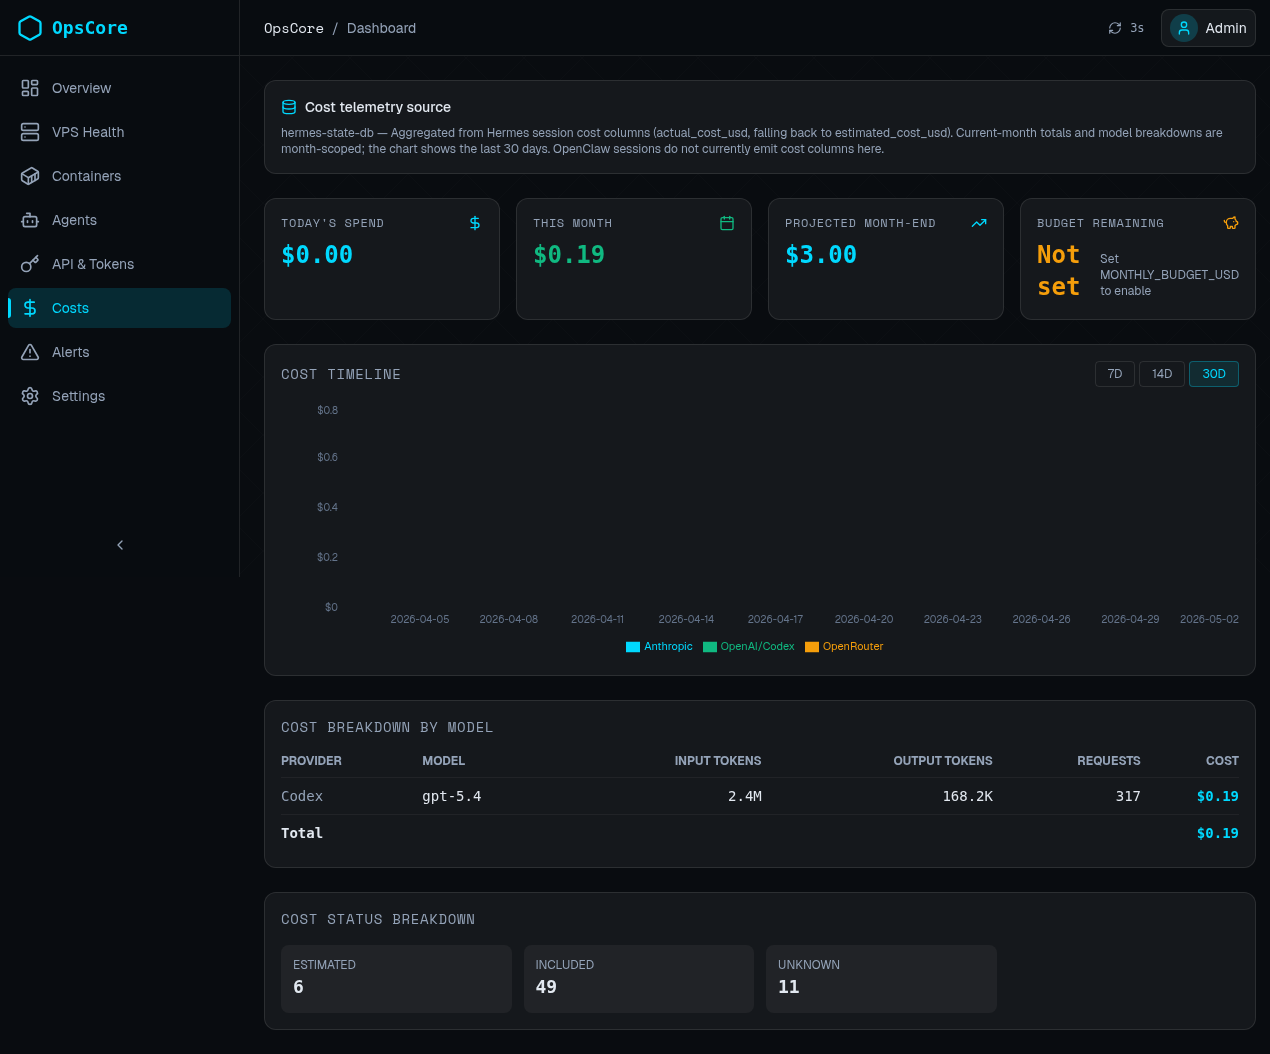
03 Dashboard in Action
The live Vercel deployment provides four views: system overview, agent telemetry, container health, and cost tracking. All pulling real-time data from the VPS agent.
04 Key Design Decisions
Split architecture: agent on VPS, dashboard on Vercel. The metrics agent runs where the containers live and exposes a minimal secured API. The dashboard runs on Vercel for zero-maintenance hosting and global access. This separation means the monitoring frontend never competes for VPS resources with the services it's watching.
API-key authentication over complex auth. The agent endpoint is secured with an X-API-Key header rather than OAuth or session-based auth. For a single-operator monitoring tool, this is the right tradeoff: simple to implement, easy to rotate, and sufficient for the threat model.
Read from state directories, not container internals. Rather than instrumenting each service, the agent reads from mounted state directories that services already write to. This means monitoring doesn't require changes to monitored services. It observes their existing file-based state.
05 Challenges
Getting Traefik routing right for multiple services plus a metrics endpoint on the same VPS required careful label configuration. The OpsCore agent needed to be exposed directly on its port rather than through Traefik's routing, since it serves a different access pattern than the web-facing services.
Real-time polling from a Vercel-hosted frontend to a VPS agent introduced CORS and latency considerations. The polling interval needed to balance freshness against unnecessary load on a box already running production services.
06 What I Learned
Monitoring earns its cost fast
The first time you catch a disk-full condition from your phone instead of discovering it when a deploy fails, the dashboard pays for itself.
Keep the agent minimal
A monitoring agent that consumes significant resources on the box it's monitoring defeats its own purpose. Read files, serve JSON, nothing more.
Separation of concerns scales
Compute where the data is, present where the user is. This pattern works for monitoring and generalizes to most observability architectures.
File-based state is observable
Services that write state to files are inherently easier to monitor than services that only keep state in memory or databases.
07 Why This Matters
This project demonstrates full-stack infrastructure thinking: designing a monitoring system that covers the Python agent, TypeScript dashboard, Docker containerization, Traefik routing, and Vercel deployment as a single coherent system rather than isolated pieces.
It shows the operational side of running AI services in production. Building agents is one thing. Keeping them running, visible, and debuggable is another. OpsCore is the answer to "how do you know your agents are healthy?" Real metrics, not hope.